Activity 4h:Using AD/AS model to illustrate the effects of the COVID-19 pandemic
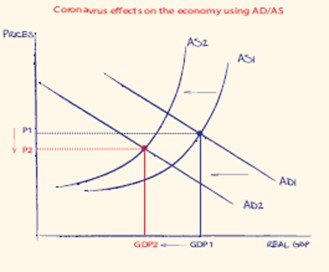
- The Demand curve shifted to the left because lockdown measures made it more difficult for Australians to purchase or demand goods and services. In addition, consumer confidence and business confidence fell to low levels which caused both consumption and investment as components of aggregate demand to decline. Further, given that covid was a pandemic, the decline in global rates of economic growth also negatively impacted on Australia’s export demand.
- The aggregate supply curve shifted to the left because supply chains around the world were disrupted and the social distancing/lockdown measures prevented businesses from producing goods and services. this reduced the capacity of the economy to produce goods and services therefore shifting the aggregate supply curve to the left.
- This occurred because the negative demand side effects on the economy was stronger than the negative supply side effects which ultimately caused prices to fall.
- Once Australia rolls out a covid vaccination program, we will begin to see a returned to normal levels of economic activity, as the incidence of lockdowns will fall (or disappear) enabling businesses to produce goods and services at the same rate is before, which pushes the aggregate supply curve back to the right. In addition, the greater freedoms that vaccination will provide for people to move around with a reduced risk of infection will help to increase aggregate demand, shifting the AD curve back to the right. Households and businesses will be more able to demand goods and services, and consumer/business confidence will begin to accelerate. Similarly, international borders will open which will facilitate growth in net exports (e.g. a resumption of tourism and education exports). The use of the AD/AS diagram will therefore help us to predict what will happen to both GDP and inflation given that growth in both AD and AS will occur.